Inspecting Logs
Start Control
All requests to the document maker are stored in a request log table which can be accessed via Start Control.
This should be the first place you check when trying to diagnose issues.
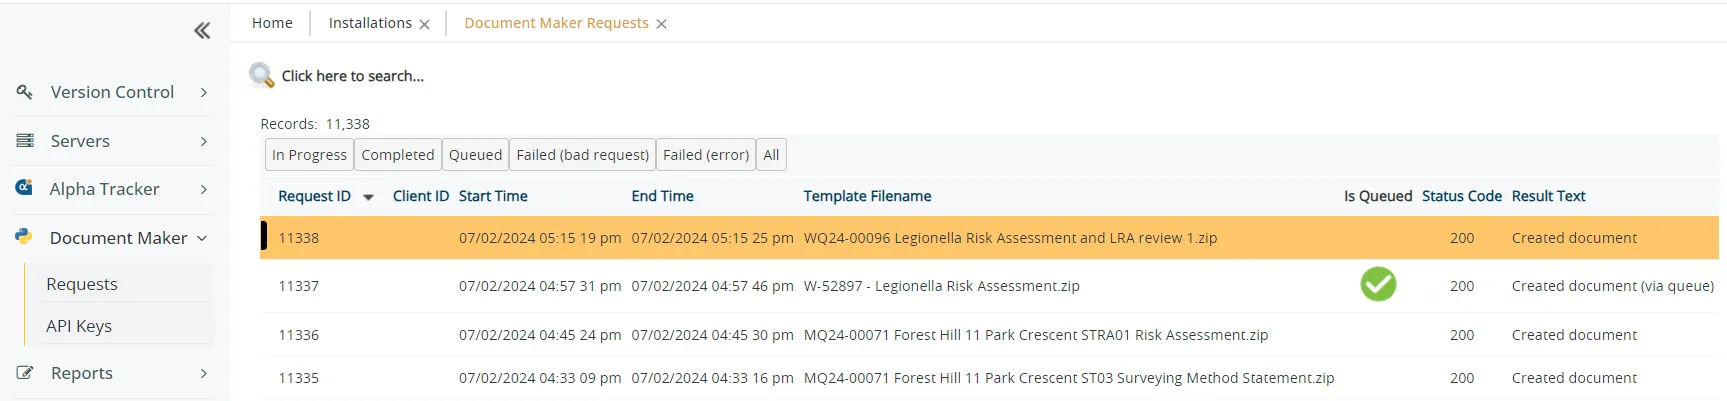
| Column | Description |
|---|---|
| Request ID | The ID of the request, you can use this to find the folder in S3 |
| Client ID | The ID of the client sending the request, comes from the API key used in the request |
| Start Time | The time the request was received |
| End Time | The time the request has completed |
| Template Filename | The filename of the template supplied |
| Is Queued | Wether or not the request has been sent to a queue to be processed by Celery |
| Status Code | The HTTP status code of the response. See status codes |
| Result Text | Text indicating the result of the request |
If there is no log entry for your request it is likely that there has been an issue with sending application. Check the applications logs for potential errors.
Status codes
| Code | Description |
|---|---|
| 200 | Success |
| 400 | Validation error. Check result text for details. |
| 403 | Authentication error. Check the API key used in the request. |
| 500 | Server error. Look in the Elastic Beanstalk logs for details. |
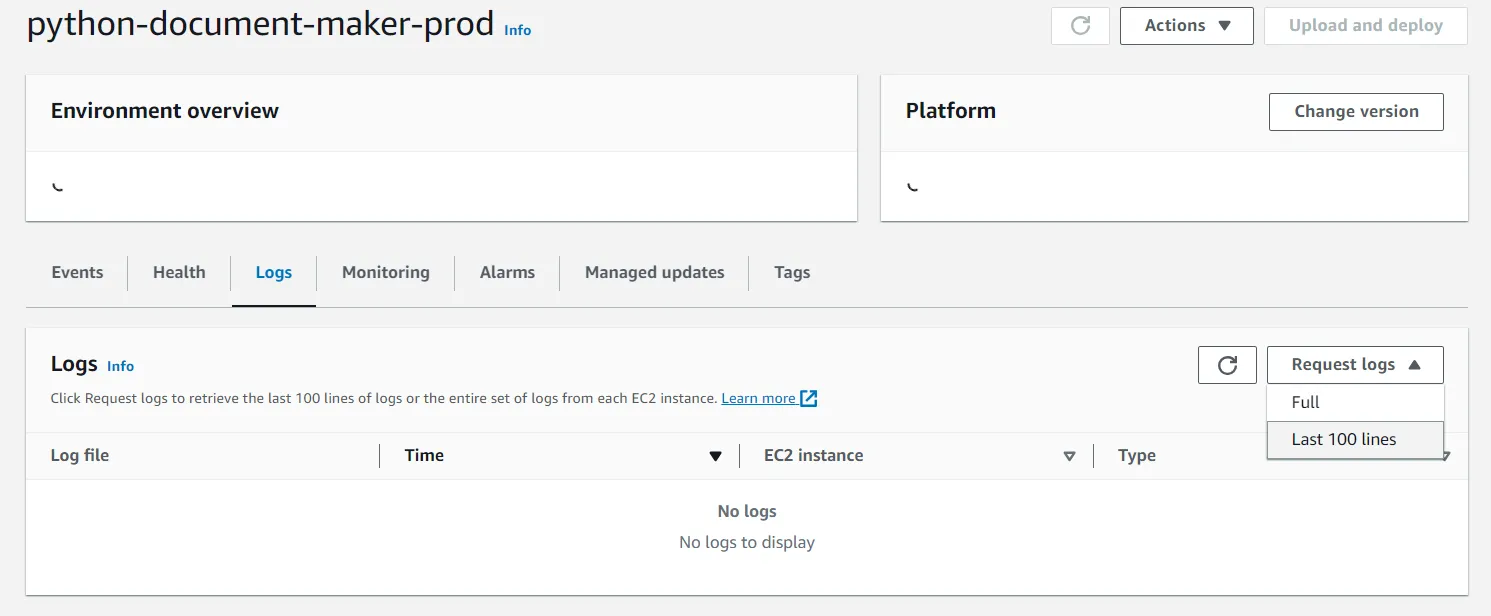
Elastic Beanstalk
If there is nothing useful in the Start Control logs you can get log files directly from Elastic Beanstalk.
You can either get the last 100 lines or full logs. The full logs option gives you a .zip files with many different log files inside.
Log files where you are likely to get something useful are as follows:
pdm_errors.log- Errors outputted from the Python codepdm_warn.log- Warnings outputted from the Python codepdm_debug.log- Debugging info outputted from the Python codepdm_timing.log- Timing info outputted from the Python codeweb.stdout.log- Errors captured by elastic beanstalknginx/error.log- Errors thrown by the the nginx reverse proxy